Introduction
Code Composer Studio works as an integrated development environment (IDE) for TI’s microcontrollers and CPUs. It is made up of several tools for writing and troubleshooting embedded programs. The IDE can be downloaded on desktop computers running Windows®, Linux®, and macOS®. Also, by leveraging the TI developer zone, it can be utilized on the cloud.
CCS has multiple features that include a source code editor, debugger, profiler, project build environment, efficient C/C++ compiler, and many more. The user-friendly IDE helps you in every stage of the application development flow. And most importantly, the smooth operation of the tools and interfaces makes it easy to begin.
Code Composer provides an environment that is feature-driven and appealing, by utilizing the Eclipse® and Theia frameworks together with cutting-edge TI capabilities. Not only this but the code composer studio allows development in the cloud without any necessity to initialize and install a huge amount of software.
Debugging Overview
Embedded software debugging is the procedure of assessing how an application behaves when it is put in an intended environment and treated with various boundary conditions. To discover faults or changes in the behavior of the program, the debugger and its supporting hardware components help to provide strict control over the execution and full visibility over the internal characteristics of the target environment.
The CCS envirocodenment’s debug phase comes after the project is created. It allows the application executable file to be loaded into the target environment for debugging, after a successful assembly, compilation, and link procedure.
Let’s see how the physical debugging is done with the two primary parts involved in a debugging session, as shown above:
1. Here, a piece of hardware is the link between the host PC that manages CCS, and the board or device where the code is to be executed.
2. Hardware (a board, or device) includes one or more devices, for better functioning of the executable.
When combined with CCS, this configuration enables the host computer to interact with the target, load data, and code, and monitor program execution using step operations and breakpoints/watchpoints. It also reads data back to the host computer for presenting in views such as Expressions/Memory/Disassembly.
Let’s now discuss the efficient and important ways for debugging that can be followed-
Points to follow for Efficient Debugging
Keeping Hardware Watchpoint or Hardware Breakpoint
Debugging a program involves using a hardware watchpoint to halt the execution of a program just before a write or read access to a data variable address. This access could be from the processor or DMA (Direct Memory Access) to a targeted memory location.
If a data variable address is written with different data values multiple times in a program, you can use a hardware watchpoint to locate the desired place in a code.
On the other hand, you use a hardware breakpoint to stop a processor. You can use the software breakpoints in the volatile memory and the hardware breakpoints in the targeted memory location. It doesn’t matter if the program runs on RAM or ROM.
Animation
You can use animation the same way as the run command with the difference that it continues execution even after hitting the breakpoints.
This way, you can analyze the values getting updated in the window when the target application halts. It automatically resumes execution of the target application till it reaches a breakpoint and continues the process till it stops through manual intervention.
Animation is useful in examining input buffers, output buffers, and any other kind of data that the program processes. When you need to debug any feature, you can change the variable that controls it from the watch window and observe the output buffer as the values update according to that feature.
This feature is available till CCSv3 but you can get it in the above versions by keeping the target running when a breakpoint is set, and the breakpoint property is set up to update all windows.
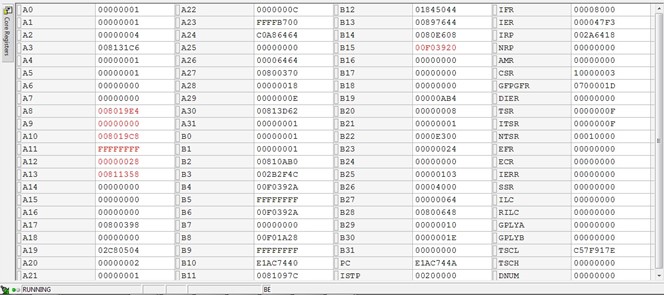
General purpose register values
Code Composer Studio provides information on general-purpose register values. These registers can hold the data, data address pointers, or core registers.
Each register holds values that you can check when you debug a problem in a code. Suppose you have stored the stack pointer in register B15. If you know that register B15 holds the stack pointer address, you can check the value on this address in the stack memory.
Same way, other registers give information about the last executable function, loop counter, frame pointer, and program fetch pointer.
Image 1.1 shows all core register values.
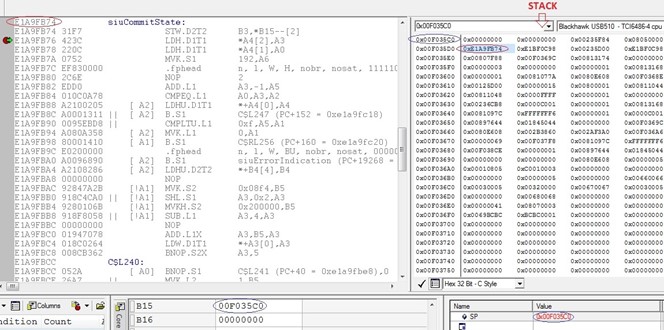
Reverse Stack Analysis
Many a time it is difficult to trace the function by just looking at the call stack window.
For example, when a program comes across a function pointer, sometimes, it cannot get the direct function flow. Or, the debugger may lose the return address of the original function if a call goes to an invalid or incorrect address location. It may prompt the call stack to provide the wrong information. In such scenarios, the stack pointer is fetched from the register and verified by checking each possible next function in the stack trace, getting the code flow, and the module names.
As there are asynchronously executed tasks or functions in the stack trace, you can identify the bugs by cross-checking the addresses shown there.
Image 1.2 shows the register value in B15 as the stack pointer (SP) in a stack and the address that it points to.
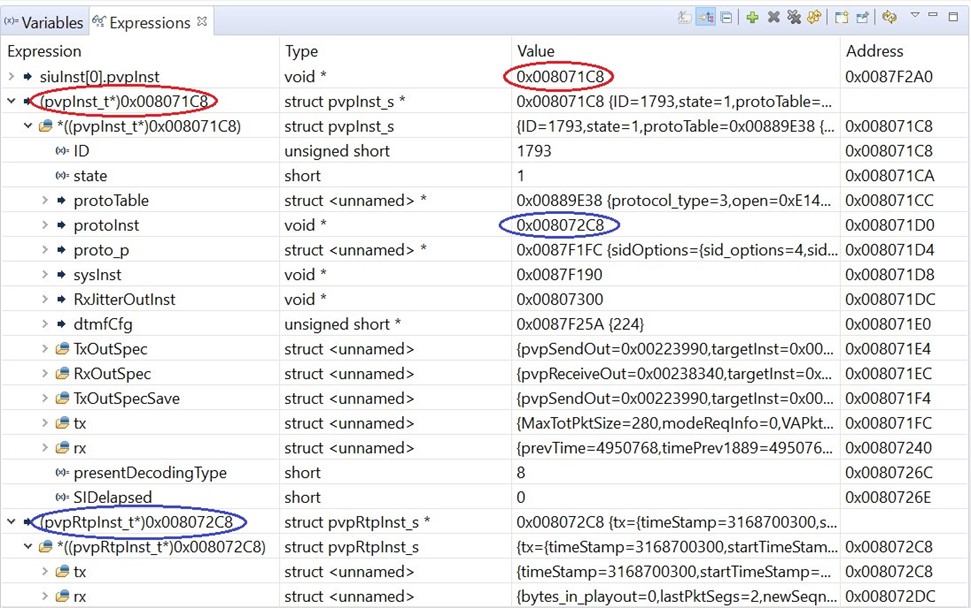
Typecasting variables in watch/expression window
You can use a watch window or expression window to view and modify variables and expressions. This window displays and expands arrays, structures, and pointers. The term watch window is used till CCSv4 and all the updated versions call it expression window.
It’s possible while debugging a function, to use CCS’s typecast feature to expose the values of a structure or variable if you only have the pointer address.
Hence, typecasting helps to determine the values in complex variables and structures that are not readily available.
Image 1.3 shows the pointer pvpInst typecasted with its respective structure to give the address of protoInst and other values in it. In the same way, protoInst is typecasted with its respective structure for getting the values in it.
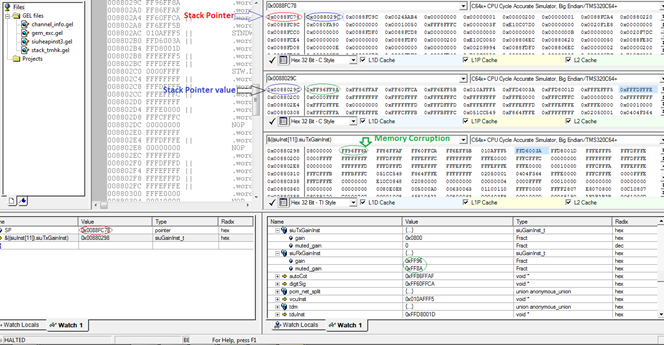
Checking Memory Corruption
Numerous reasons can cause memory corruption like overlaying buffers, structures alignment, and buffer alignment.
You can check all the buffer addresses in the memory window to identify the corruption, but, it is a lengthy procedure. So, the stack trace provides memory sections/functions that were called and caused the crash.
If you direct the function in the stack not to make calls to the next chunk of memory/function, you can identify the function that may be causing trouble.
For example, if the processor is working fine in the normal scenario and the problem is occurring in a special scenario. You can verify the function pointers of the stack in the problem scenario by comparing the stack to the normal working scenario. During the inspection of a stack trace, if you can not find the expected function pointer in the stack this will help in identifying the problem function.
Image 1.4 shows memory corruption with the help of stack pointer value.
Locating Interrupt
An interrupt is an event generated by the hardware and software that causes the target processor to stop executing instructions in the active thread and start executing them at a pre-defined location for that particular interrupt.
The Interrupt Service Routine (ISR) performs this processing as it is required to save the interrupt context of the thread to a specific location such as a stack.
You can restore the thread’s interrupt context from a specific location, once the ISR has processed the interrupt.
If you know where the context is saved, you can recover the code that was executed before the ISR was called.
The interrupt registers may also be able to give you the interrupt information like the status of the interrupt (whether it is enabled or disabled), interrupt return pointer registers, interrupt service table pointer registers, and so on.
All the above-mentioned points help in debugging interrupt-related issues.
If a DMA interrupt is not completed in time, the other pending tasks that are necessary for the DMA transfer completion may block the processor.
In this case, the processor is waiting for interrupt service to complete. With the help of interrupt enable register, you can recognize the enabled interrupt. And with the help of interrupt return pointer register, you can get the pending task function from the return pointer of the address location through which the service routine returns to the program flow.
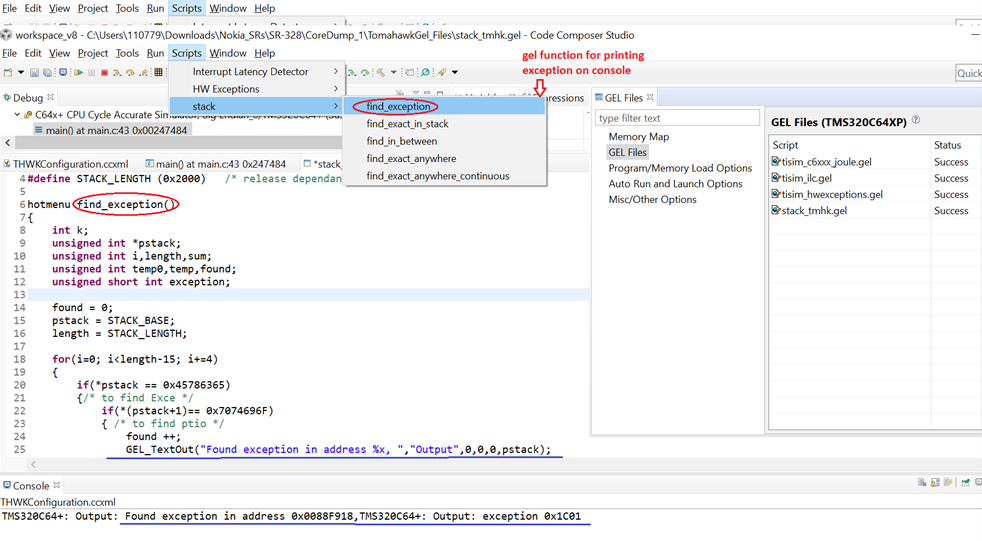
Writing your GEL files
CCS IDE has its General Extension Language (GEL) that can be used for automated debugging.
You can write your GEL functions and call them anytime and anywhere to get general information like register values, memory locations, or values of global variables and see the output on the console window.
For example, you can print the exception code value on the console using a GEL function, when a controlled exception occurs or print a set of variables, memory addresses whenever the processor halts.
mage 1.5 shows the printing of the exception value using the GEL function on the console.
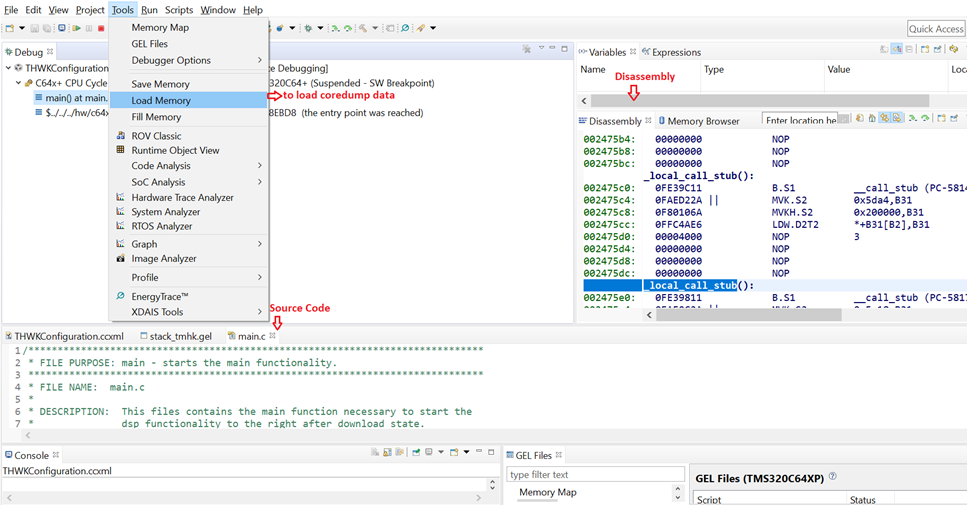
Analyzing through Core dumps
When a multi-core processor fails during the load test or in a live environment, then debugging is not possible as there could be an issue in that scenario. In such cases, generating a core dump is the best option.
You can add a mechanism in your code to generate core dumps that can be loaded into the platform’s CCS simulator to analyze any issues that may occur. For this, you can trigger a simple function from a core other than the core of the processor that crashed by taking core dumps. You can copy the data from the specified memory location of a given length to an output file and convert it into CCS readable data files to load it onto the CCS. You can load the program (.out) file which opens the disassembly window that shows the disassembled instructions representing the program.
You can use the same debugging techniques in a simulator as we use in the emulators. For example, reverse stack analysis, checking memory corruption, and using your GEL files.
Image 1.6 shows how to load core dump data and view disassembly and source files in CCS.
Conclusion
Texas Instrument processors are used across the globe. Equally active are its debuggers. Therefore, using Code Composer Studio and implementing a suitable debugging technique, might help you save your debugging time. When choosing a debugging technique, you must analyze each technique and use the ideal one that meets your needs. The Code Composer Studio can help in increasing the performance and getting faster output from your debugging session. eInfochips – An Arrow company has been working on Texas Instruments DSP processors for audio, image, and video processing for more than 15 years. While working for many customer projects in the field such as VoIP over Internet Protocol (VoIP), IP Phones, etc. eInfochips has developed many Proof-of-concept Applications on Texas Instrument DSP in association with Texas Instrument. To know more about our expertise please contact of experts today.
References
Can change the introduction – https://www.ti.com/tool/CCSTUDIO
Please go through this video – https://www.ti.com/video/6313258641112
Add a section of Debug Overview – https://software-dl.ti.com/ccs/esd/documents/users_guide/ccs_debug-main.html