Introduction
Azure Kubernetes Service (AKS) is managed Kubernetes service that makes it easy to emplace, manage, and scale containerized operations. Monitoring and observability of systems is one of the core uses of Prometheus, but it can be confusing because it is used in different contexts. Understanding the fundamentals of Prometheus, its significance in enhancing system observability, and practical user applications empowers you to utilize Grafana more proficiently.
Difference Between Monitoring and Observability
In monitoring, you can observe real-time events or delve into past data, limited only by the capabilities of your tools and platforms. Typically, alerts can be set depending on a monitor threshold.
Observability is the ability to respond to the information gathered from the environment. Observability examines metrics, traces, and logs. For instance, if the Kubernetes cluster has the /metrics Application Programming Interface (API) enabled, it can consume data from it. Then, an observability tool can act if something notable appears in the metrics, traces, or logs.
To put it briefly, observability is the ability to act based on data insights without constant manual monitoring. Whereas monitoring is the ability to view data in real-time.
Problem Statement
The built-in monitoring tools provided by AKS currently offer insights into cluster performance, but they lack the flexibility to create customized dashboards and visualizations. Without a robust monitoring system such as Grafana, troubleshooting and identifying performance bottlenecks, resource utilization issues, or abnormal behavior in the cluster becomes time-consuming and complex. Efficiently scaling the AKS cluster requires detailed monitoring data. Currently, monitoring setups do not support custom alerts and notifications, which hinders timely responses to critical events.
The use of cloud computing is widespread in today’s technological environment. To maximize the cloud’s potential and achieve significant business outcomes, organizations must craft and execute strategies to modernize and optimize their data and applications. eInfochips assists many businesses in starting their cloud journey with strategic cloud service offerings in cloud-native design and development, cloud migration, cloud strategy consulting, and cloud-managed services.
Understanding Prometheus and Grafana
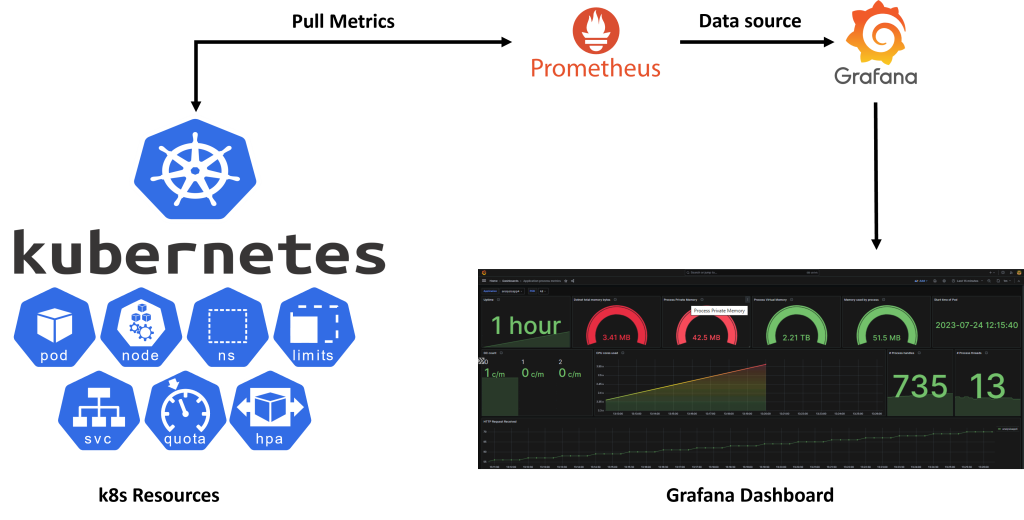
Prometheus is an open-source monitoring system that collects metrics from a variety of sources, including AKS, and can be used to monitor it. Prometheus metrics can be visualized in multiple ways using Grafana, an open-source visualization tool. Grafana transforms metrics into meaningful visualizations. Grafana is a multi-platform tool that visualizes charts using data from Prometheus sources.
Grafana is an open-source tool for alerting and monitoring systems, Prometheus collects and stores metrics data, i.e., metrics information is stored along with the timestamp at which it was recorded, along with optional key-value pairs called labels. You can query, visualize, alert on, and understand your metrics no matter where they are stored using Grafana, an open-source platform for monitoring and observability.
How it Works
Preparing AKS for Monitoring
When creating the AKS cluster, we can enable the monitoring add-on. This add-on provisions Azure Monitor for Containers, which gathers and stores AKS metrics and logs. The default monitoring of AKS offers basic insights into the cluster’s performance and health. It has certain limitations such as limited data exposure, retention, no integration with external systems, difficulty in diagnosing problems, lack of centralized log collection, and limited user access control – all of which may not meet more complex monitoring needs.
Setting up & Configuring Prometheus
By using Kubernetes manifests or Helm charts, you can deploy Prometheus in AKS clusters. You can export metrics from Kubernetes to Prometheus and then scrape them to create custom metrics. You can use exporters or client libraries to create custom metrics. To automate metrics deployment, use Prometheus-operator.
Integrating Grafana with Prometheus
Grafana can be deployed in the AKS cluster as a separate pod or using Helm. We can add Prometheus as a data source in Grafana to access Prometheus metrics.
Monitoring and Visualization
AKS metrics can be visualized in Grafana with custom dashboards. Include examples of metrics to monitor, such as CPU and memory utilization, network traffic, and pod health. We can extend Grafana’s monitoring and visualization capabilities through Grafana Plugins, such as heatmap visualizations, advanced graphs, and annotations, as well as create dynamic dashboards with Grafana’s templating feature.
Features
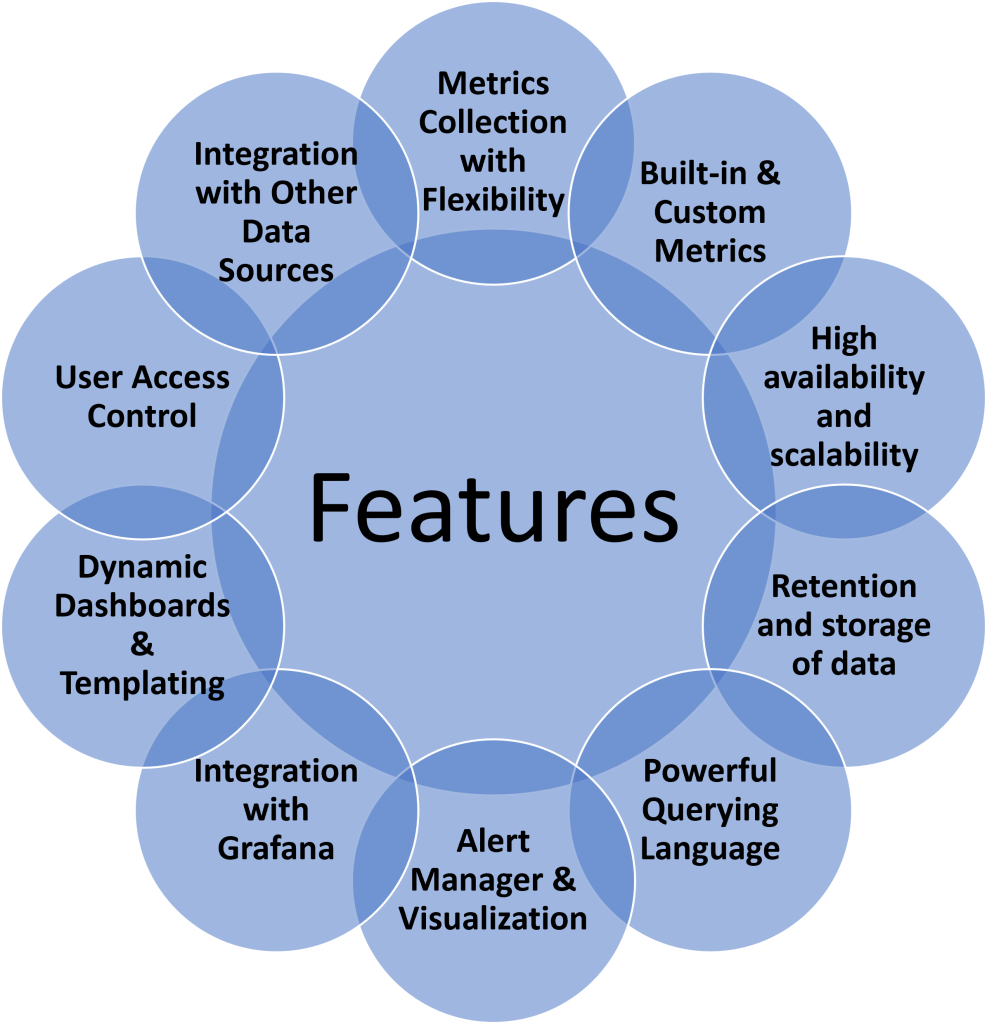
Metrics Collection with Flexibility: There are various metrics that can be collected using Prometheus, including counters, gauges, histograms, and summaries for nodes, pods, containers, and services.
Built-in & Custom Metrics: It is easy to scrape and collect built-in metrics from AKS, giving Prometheus a holistic view of the cluster’s health and performance. There are metrics such as Node metrics, which measure CPU, memory, and disk usage, Pod metrics, which measure CPU, memory, and network traffic for each pod in your cluster. You can also collect custom application-specific metrics using Prometheus to monitor the performance of your applications running on AKS. These metrics measure latency, throughput, and error rate.
High availability and scalability: When configured properly, Prometheus can maintain high availability for critical monitoring data by handling large numbers of metrics and high data ingestion rates.
Retention and storage of data: Using Prometheus’ data retention settings, you can balance data storage requirements with historical analysis requirements.
Powerful Querying Language: AKS monitoring data can be analyzed and aggregated using Prometheus Query Language (PromQL), allowing you to gain valuable insights.
Alert Manager & Visualization: Grafana can display Prometheus alerts directly on dashboards, providing a unified view of metrics and active alerts through the Alert Manager component in Prometheus.
Integration with Grafana: By integrating Prometheus alerts with Grafana, you can receive email or Slack notifications. A highly customizable and user-friendly data visualization platform that complements Prometheus, Grafana allows you to create interactive dashboards with a variety of visualization tools, such as graphs, charts, and tables.
Dynamic Dashboards & Templating: Grafana simplifies the monitoring of multiple AKS environments with dynamic dashboards and advanced graphing options such as heatmaps, anomaly detection, and a variety of graph styles. Not only that but templating also allows you to create reusable templates for variables like namespaces, clusters, or labels, making dashboard creation and management easier.
User Access Control: The monitoring data and dashboards in Prometheus and Grafana are protected by user access control and authentication mechanisms.
Integration with Other Data Sources: With Grafana, you can combine AKS metrics with data from other monitoring systems, databases, or external services.
Best Practices
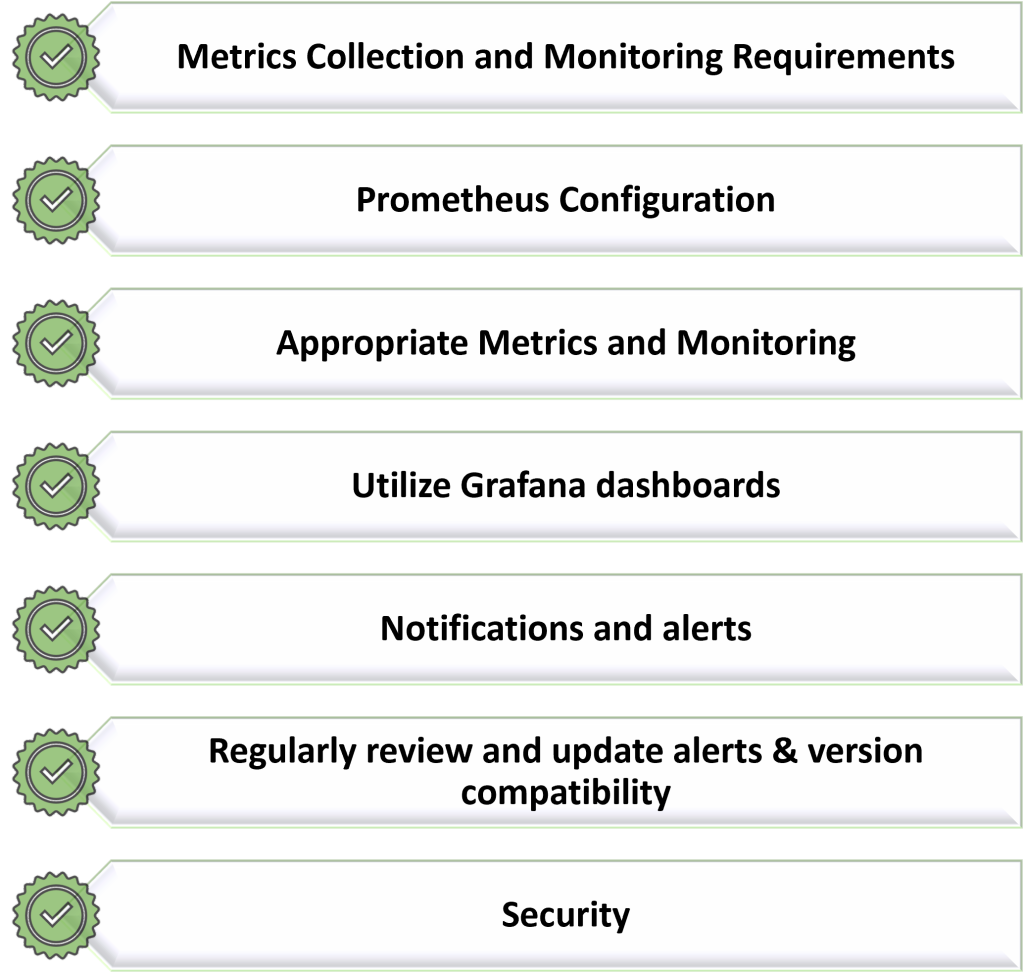
Metrics Collection and Monitoring Requirements: Define your monitoring objectives, key metrics, and alerting thresholds according to the specific needs of your AKS workloads and applications.
Prometheus Configuration: Utilize service discovery or Kubernetes API discovery to discover targets automatically. Optimize Prometheus configuration to collect metrics efficiently from AKS components.
Appropriate Metrics and Monitoring: To reduce any disturbance of the production AKS environment, Prometheus and Grafana should be installed on distinct nodes or on a different cluster. Monitor significant Kubernetes metrics, such as CPU and memory usage, pod and node health, API server latencies, and network traffic for a better analysis of the cluster’s performance. Additionally, to provide deeper insights into your applications’ performance, incorporate custom metrics with Prometheus exporters or client libraries.
Utilize Grafana dashboards: Using Grafana, create well-organized dashboards that provide comprehensive information about your AKS cluster’s health and performance.
Notifications and alerts: Set up alerting rules in Prometheus to trigger alerts based on predefined thresholds. Prometheus alerts can be integrated with Grafana to receive notifications via email, Slack, or another communication channel. Avoid false positives by setting alert thresholds judiciously. Define multiple alert levels (e.g., warning, critical) for different severity levels.
Regularly review and update alerts & version compatibility: To avoid compatibility issues, periodically review and fine-tune your alert rules based on your AKS cluster’s needs and Prometheus-Grafana components’ updates.
Security: Prometheus, Grafana, and any associated components should be secured with appropriate access controls, authentication mechanisms, and network isolation.
Conclusion
In Conclusion, Grafana provides an effortless way to monitor the health and performance of your AKS cluster. This helps you identify and resolve any issues before they affect your applications. Moreover, Prometheus and Grafana enable you to keep track of the performance and well-being of your app. Collecting metrics from all your Kubernetes nodes with Prometheus is swift while visualizing them with Grafana can be easily done. In this way, you can guarantee that things run smoothly and nip any potential problems in the bud. Furthermore, monitoring Kubernetes with these tools gives essential insights into how users are using your application so that you can make appropriate adjustments to maintain their engagement.
References
https://learn.microsoft.com/en-us/azure/aks/concepts-clusters-workloads
https://prometheus.io/docs/prometheus/latest/getting_started/
https://grafana.com/docs/grafana/latest/